Market baskets and association rules

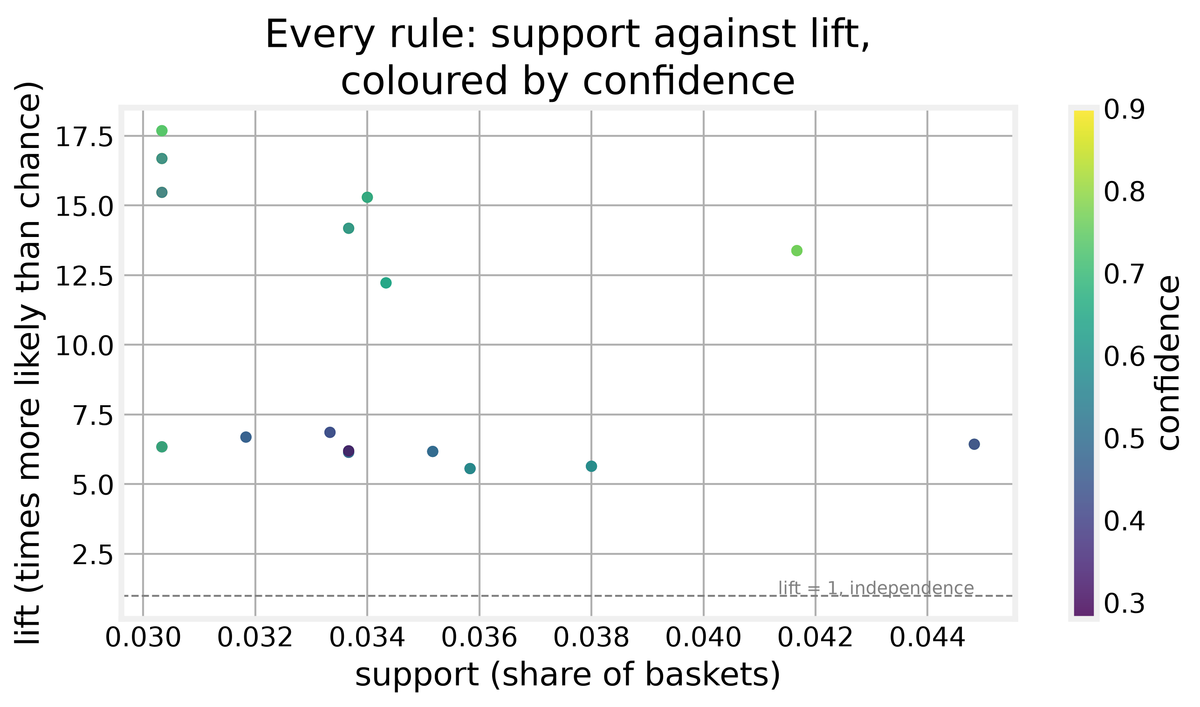
Post 15 taught us to find structure in unlabeled tabular data by clustering rows that look alike. This post goes after a different kind of unlabeled structure, the kind that lives between rows rather than inside them: what gets bought together. There is no target column, no train and test split, and no accuracy to report. What we get instead is a ranked list of if-then rules, and the headline from our run is a rule that fires in 3.0 percent of baskets with a lift of 17.68. Think of a supermarket receipt. Every line on it is a row, but the receipt as a whole is the unit that matters, and the interesting question is which items keep showing up on the same piece of paper. That receipt is our through-line for the whole post.
We work with the UCI Online Retail dataset, roughly half a million invoice lines from a UK gift retailer, and we treat each invoice as one basket and each stock code as one item. Along the way we meet the Apriori algorithm, FP-Growth, and the three scores that describe a rule: rule support, rule confidence and rule lift.
Reading the receipts
Nothing here is supervised, so the first job is to see how the lines behave before we touch anything. The raw table has 541,909 rows and 8 columns, and it takes about 132 MB in memory. The two columns we care about, InvoiceNo and StockCode, are both complete, which matters because they define a basket. CustomerID is blank for 24.93 percent of rows, but we never use it, so those gaps stay and the rows stay with them.
The messiness is real and it matters. Cancellations, non-positive quantities, non-positive prices, non-product codes like POST and BANK CHARGES, and duplicate invoice lines all fabricate co-occurrence that never happened at a till. Co-occurrence means two items appearing in the same basket. A refund line sitting next to a product would look like a pattern when it is really an accounting artifact. So we drop them, and the counts are printed as we go: 9,288 cancellation invoices, 1,336 rows with quantity at or below zero, 1,181 with a non-positive price, 2,315 non-product codes, and 10,469 duplicate invoice lines. That leaves 517,320 rows, a drop of 4.54 percent.
Figure 1 shows the distributions of Quantity and UnitPrice per line, clipped at the 99th percentile.
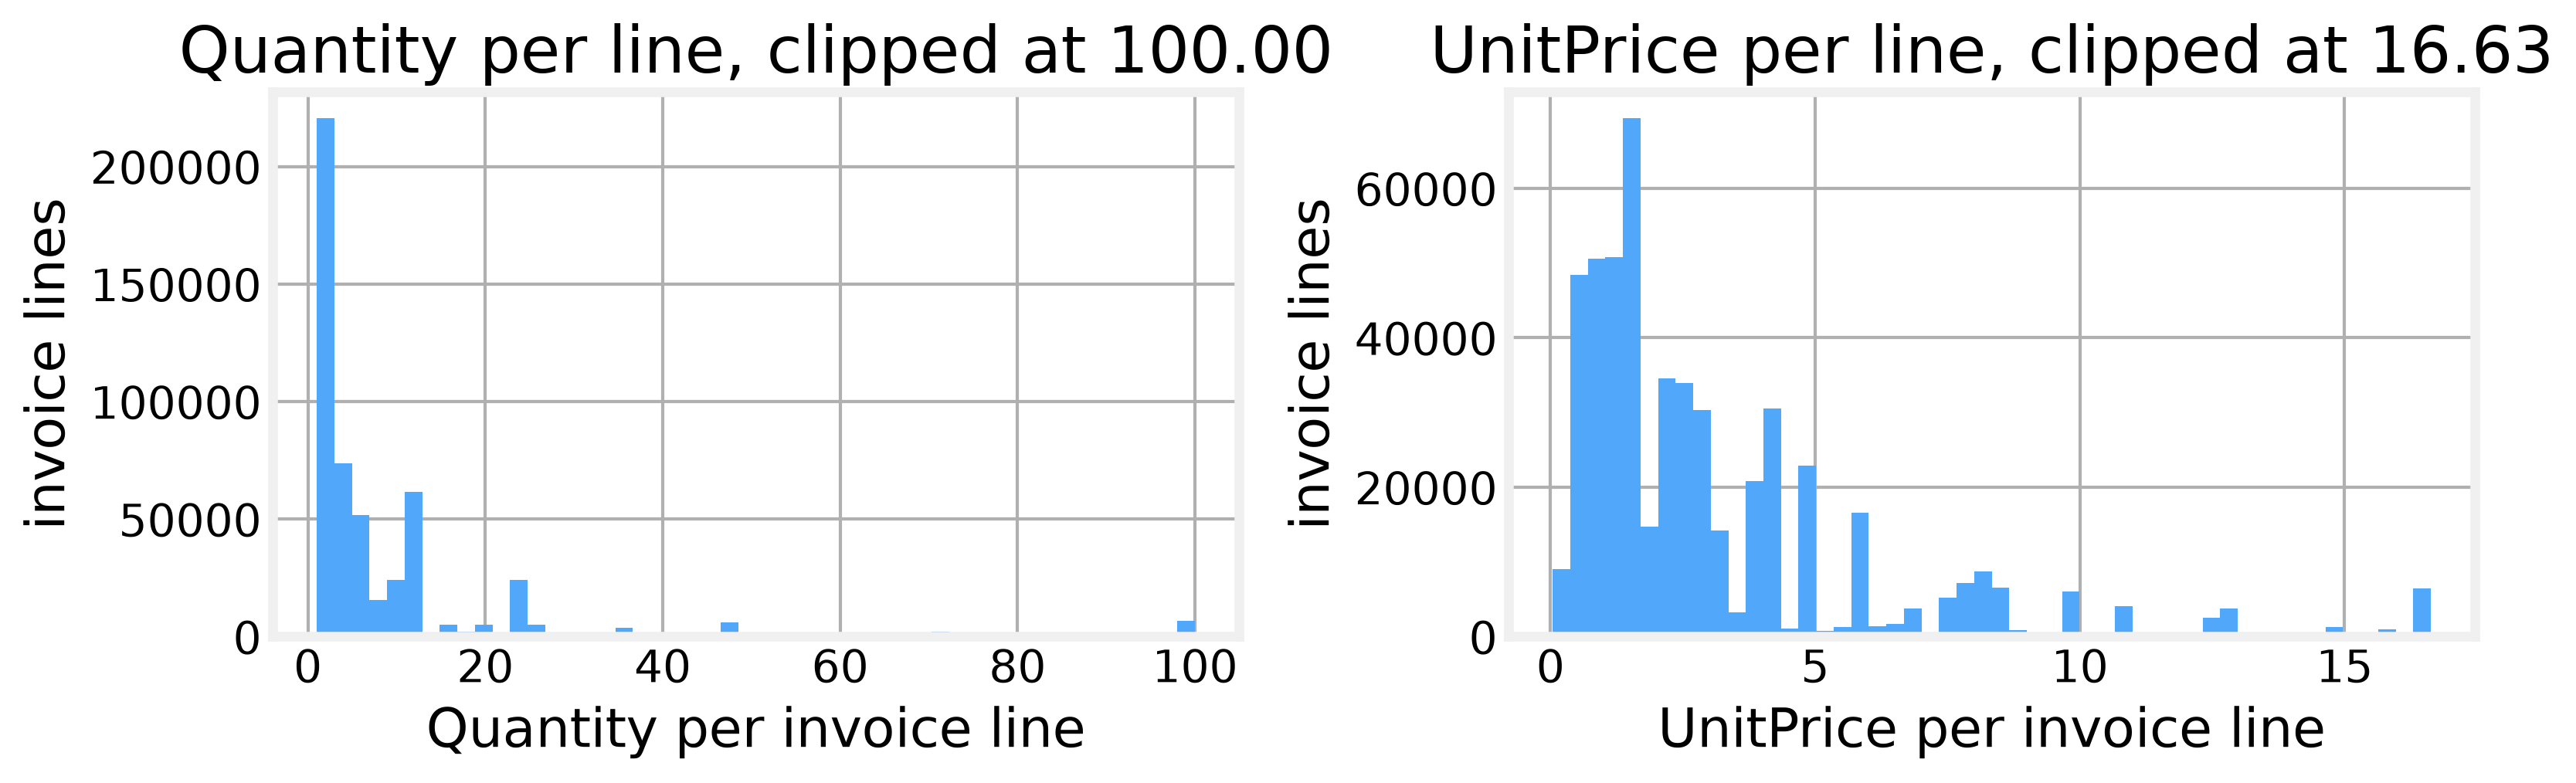
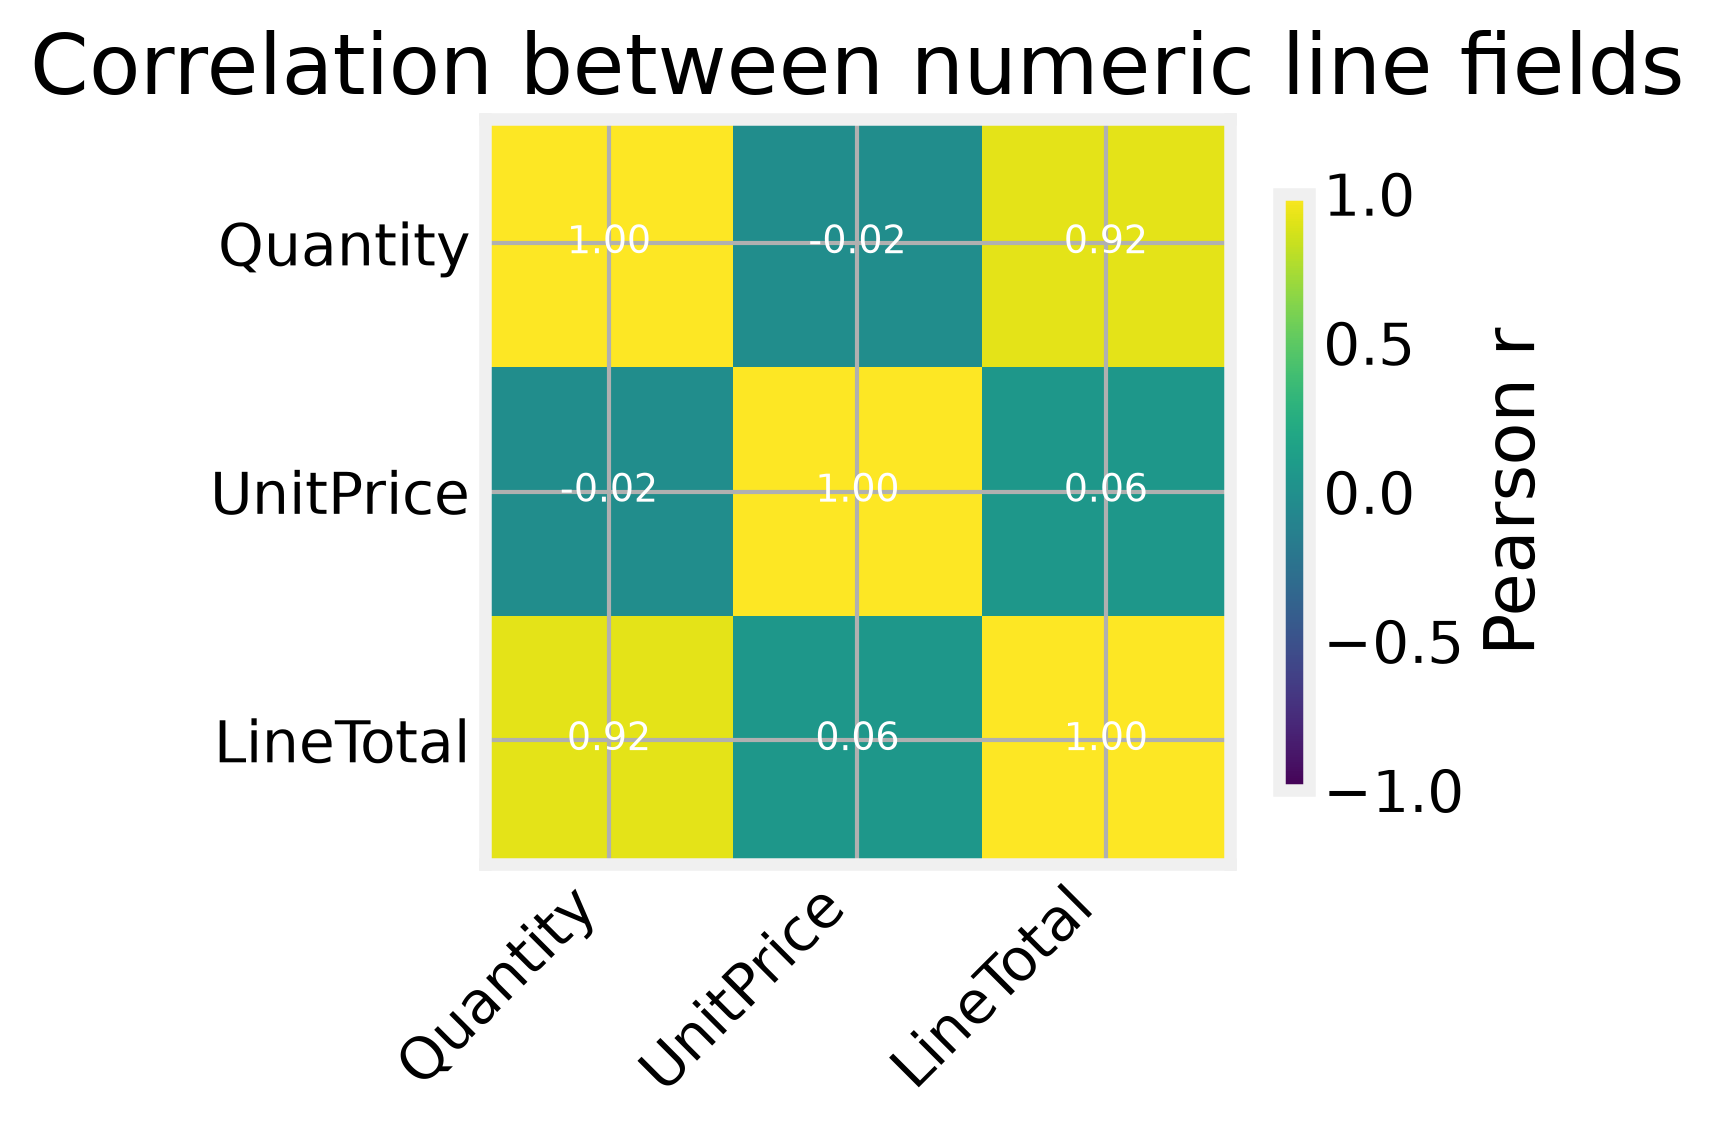
Quantity and UnitPrice are heavy tailed, which means most lines are small and a few are enormous. The median line is 4 units at 2.08, but the maximum is 80,995 units, and the IQR report flags 26,740 quantity outliers and 35,622 price outliers. The IQR rule flags values far outside the middle half. We keep them. A large order is a real basket, and dropping it would delete signal rather than noise. Figure 2 shows the correlation panel, which confirms that LineTotal, the field a merchandiser actually reads, is just the product of the other two. A merchandiser is the person who decides what a store stocks.
Once we group by invoice, we have 19,773 baskets. The median basket holds 15 distinct items and the mean is 26.16, with a maximum of 1,109. Only 1,500 invoices hold a single item, so a two-item rule describes a typical basket rather than an unusual one. Figure 3 shows the distribution of items per invoice.
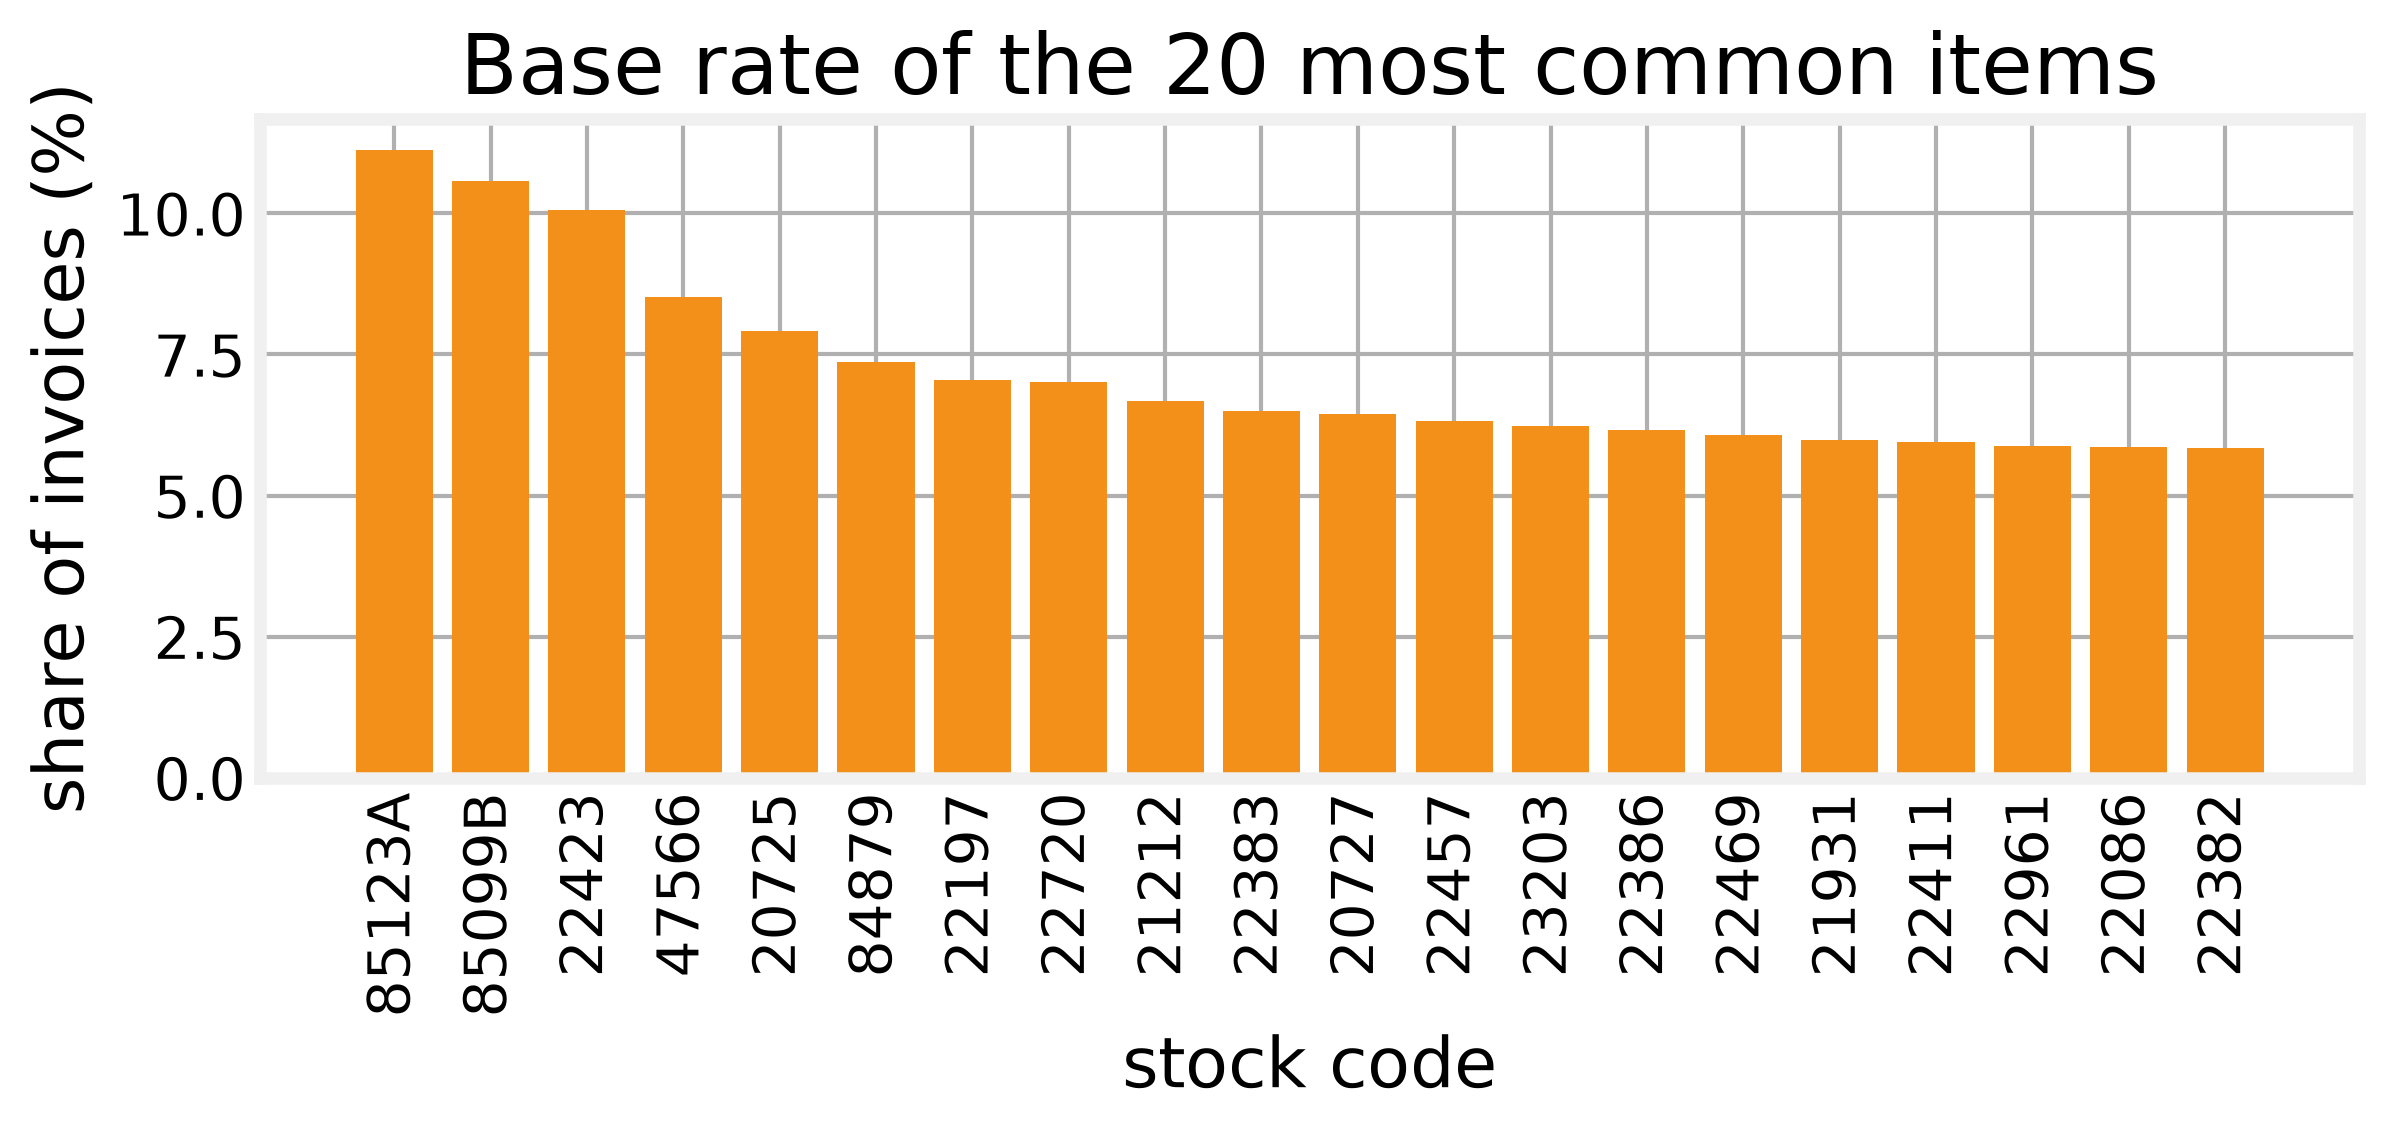
The last thing the EDA tells us is how unevenly items sell. The most common item, 85123A, sits in 11.12 percent of invoices, and the twentieth most common sits in 5.85 percent. That unevenness is exactly the structure association rules are built to find, and it also sets our support floor: any threshold has to sit well below 11 percent or no rule survives. Figure 5 shows the base rate of the twenty most common items.
Mining the baskets
That support floor is where mining starts. A rule is X -> Y: shoppers who bought the items in X also bought the items in Y. We will score rules after mining with support, confidence and lift.
Mining finds the item sets first and reads rules off them. The Apriori algorithm builds candidate sets level by level and prunes any set whose subset is already rare. FP-Growth compresses the baskets into a prefix tree and mines the tree without candidate generation. A prefix tree stores shared item prefixes along paths so repeated combinations are counted once. Both take a minimum support, so both need a threshold we can defend.